-
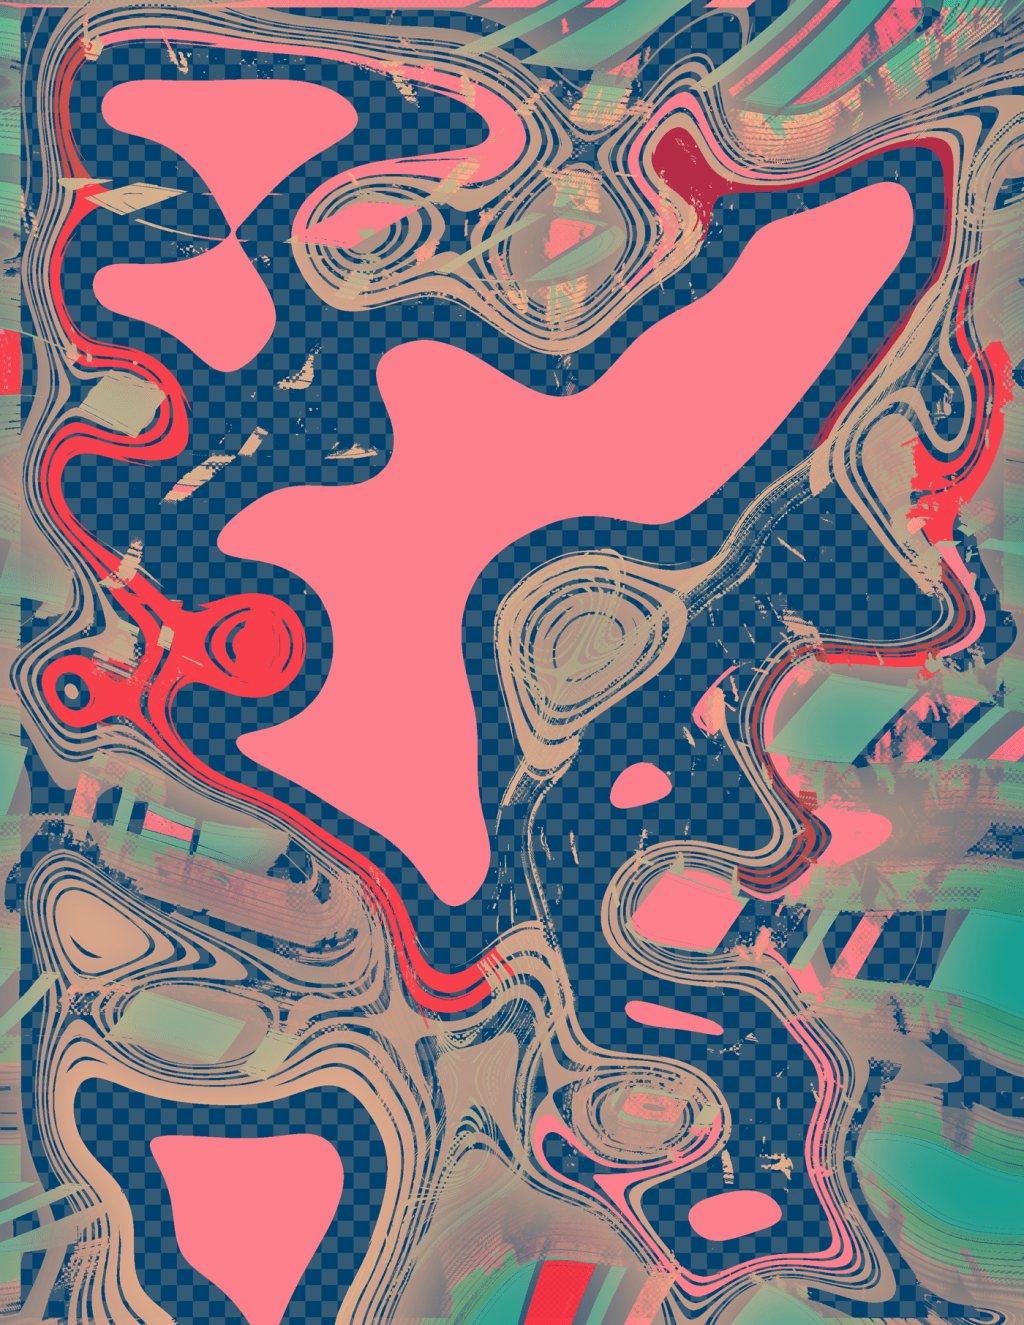
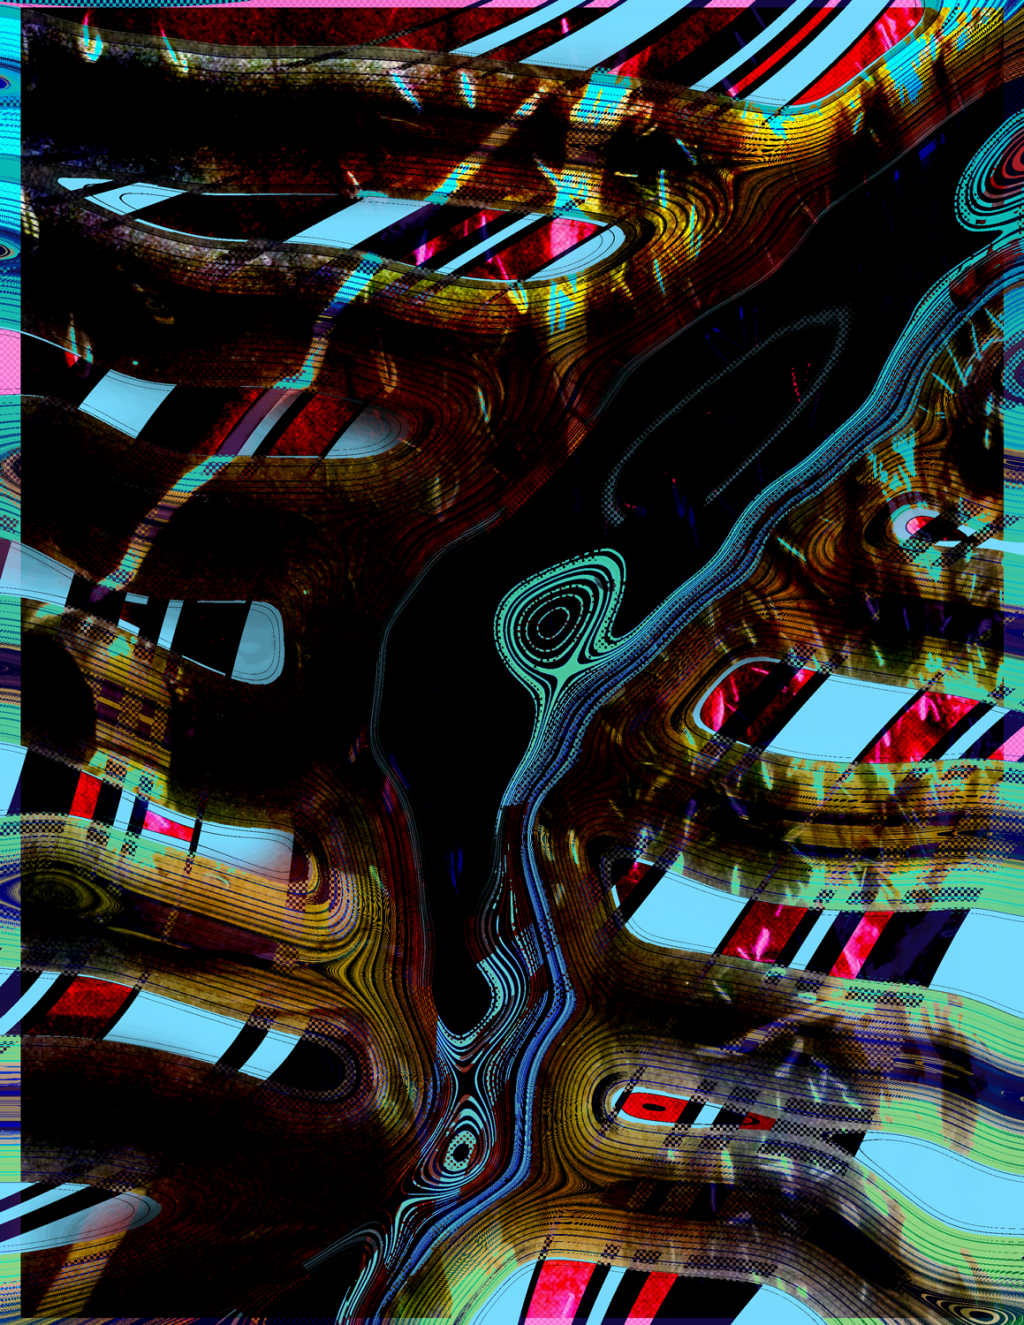
 Continue reading →: Moiré patterns as art: an unexpected discovery
Way back in 2001 I was playing around in Photoshop on the family mac desktop at the time, and found a way of creating flowing shapes that I still use to this day, and which I have not seen anyone else do in quite the same way. This was the…
-
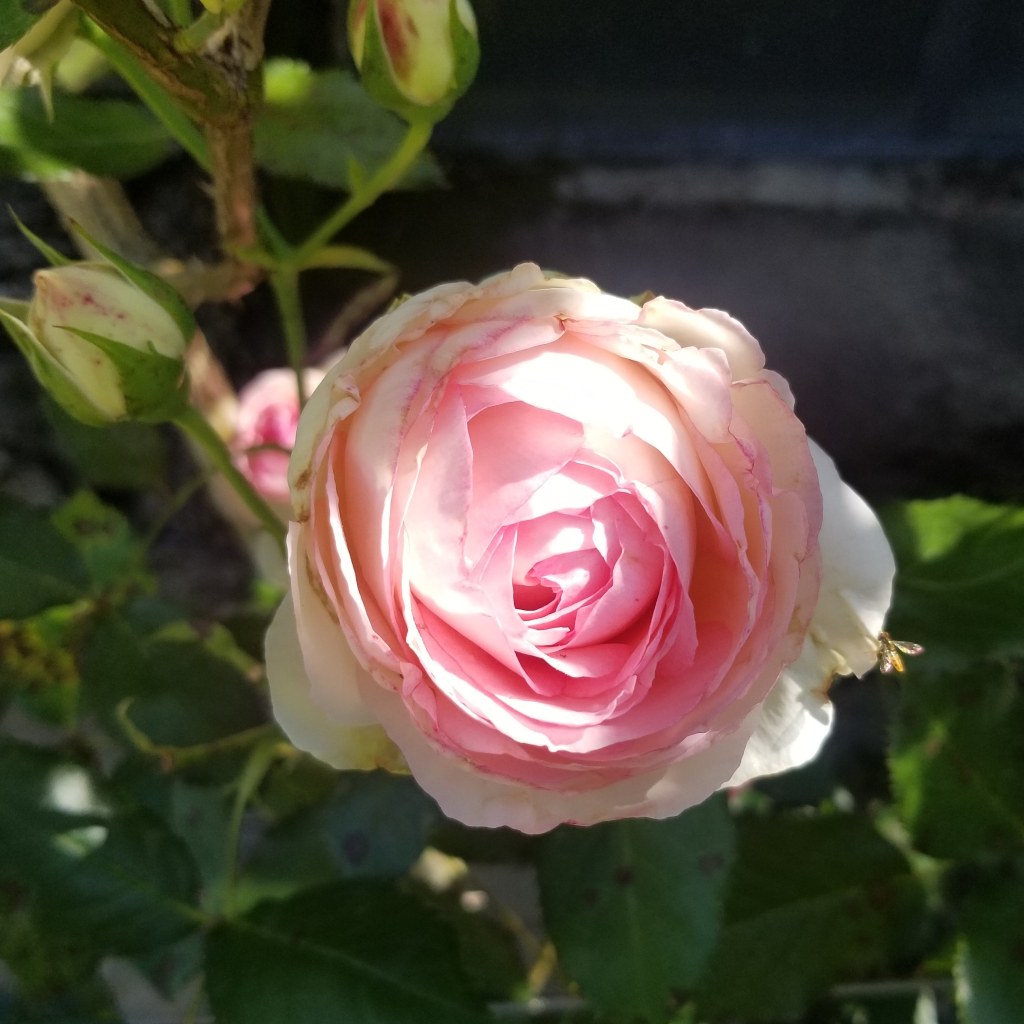
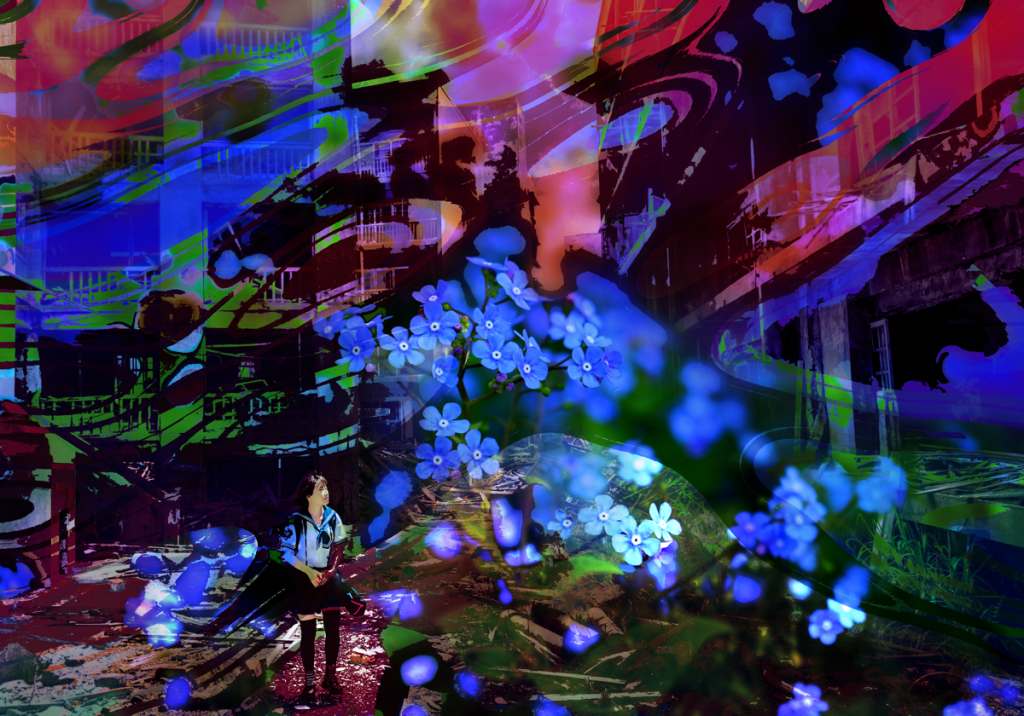 Continue reading →: Forget-me-not
A messy photomanipulation for fun, with two base images as usual: a student walking between ruined buildings, and a macro of forget-me-not flowers. Spilled color / burnt film texture and a moiré underpainting (last image in series). Embracing both inherent blur and rough bucket-fill edges. Looking forward to spring. Listening…
-
 Continue reading →: Annapurna Circuit
Another piece with nature + technology elements, this time with a Motorola MC68012 processor from the 80s and a sweeping view of the Annapurna mountains. I have made many pieces like this before, almost identically, but haven’t tired of it yet. It is an easy escape: The moiré waves overflow off…
-
 Continue reading →: Motherboard + chicory
Statement: An old ASUS motherboard photo plus a chicory inflorescence. First full image is flush with vitality and movement, while the next is a deconstruction to evoke torn up flowers and fabric. Maybe this is a botanical pressing saved to file, then excavated and found to be corrupt later. A…
-
 Continue reading →: If you can for-each, you can doParallel! Parallelization in R
One of the common complaints I hear about R as a data analysis language is its relatively slow speed, compared to the C at its foundation or other, lower-level programming languages (C family, java, fortran). For-loops can be incredibly slow! They do get the job done eventually, serially (one task…
-
 Continue reading →: Multi-plotting biological data: just one solution with R ggplot & cowplot
I have a conference coming up in two weeks, the American Society of Human Genetics (ASHG), where I will be presenting a technical poster in the bioinformatics section. The code behind the graphs will be on my github here. For this post I’d like to focus on my ggplot code…

Hello,
I’m Claire
Welcome to claire dot bio: biography and biology. This space is for publishing digital art and to connect with me professionally.
Let’s connect
Subscribe to posts!
claire dot bio: the newsletter.
